Wraps stats::cor to calculate correlation coefficients.
Construct S3 class for pensieve.
Check S3 class.
Plot S3 class.
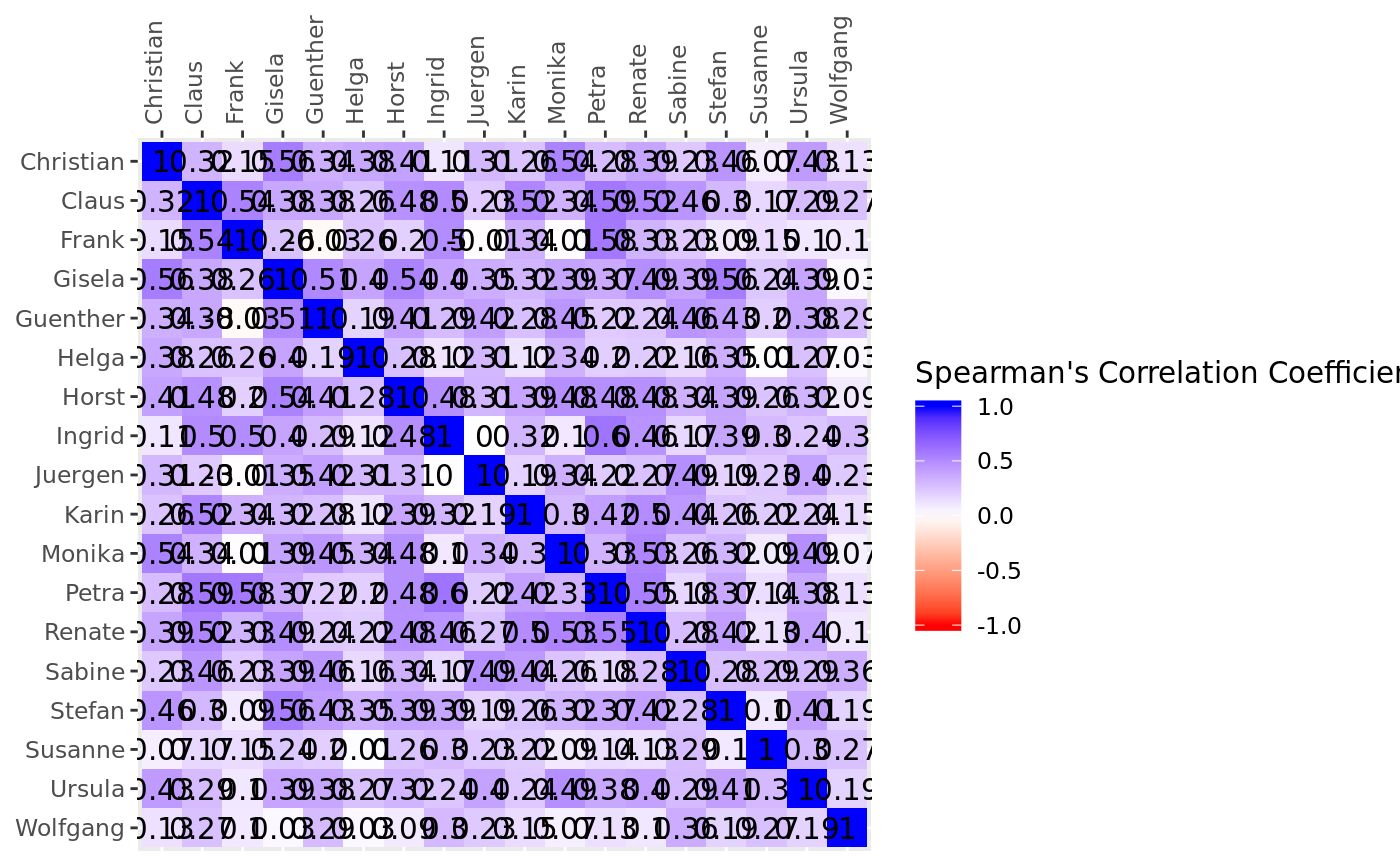
correlate(csorts, method = "spearman", use = "pairwise.complete.obs")

QCors(cors, validate = TRUE)

# S3 method for QCors
check(x)

# S3 method for QCors
plot(x, summarize = NULL, n_obs = NULL, use_js = NULL, ...)
Arguments
| csorts |
|
|---|---|
| method | A character string indicating which correlation coeffocient to use.
Must be |
| use | A character string giving a method for computing covariances in the presence of missing data.
Must be |
| cors | A numerical matrix with correlations. |
| validate | a logical flag, indicating whether the object will be validated on construction.
Defaults to |
| x | class object created by respective constructor function. |
| summarize | A logical flag, indicating whether the object should be summarized before plotting.
If Defaults to |
| n_obs | Integer scalar, giving the number of observations (here: items), on which the correlations are based.
Defaults to |
| use_js | A logical flag, indicating whether an interactive, java-script variant of the plot should be returned.
Defaults to |
| ... | Arguments passed onto other methods. Not currently used. |
Methods (by generic)
check: validationplot: plotting
See also
Other analysis functions:
extract(),
score()
Other S3 classes from pensieve:
extract(),
psClosedSorts(),
psGrid(),
psItemContent(),
psOpenSorts(),
psOpenSort(),
psPeople(),
score()
Other plotting functions:
extract(),
psClosedSorts()
Examples
# this just runs the calculations, but also classes and validates the results cors <- correlate(csorts = civicon_2014$qData$sorts[,,"before"]) # this just assigns the class, without validation (not recommended) cors <- QCors(cors = cors, validate = FALSE) # this validates the class check(cors)#> [1] TRUE# makes density estimate plot(x = cors, use_js = NULL, type = "density", n_obs = nrow(civicon_2014$qData$sorts[,,"before"]))